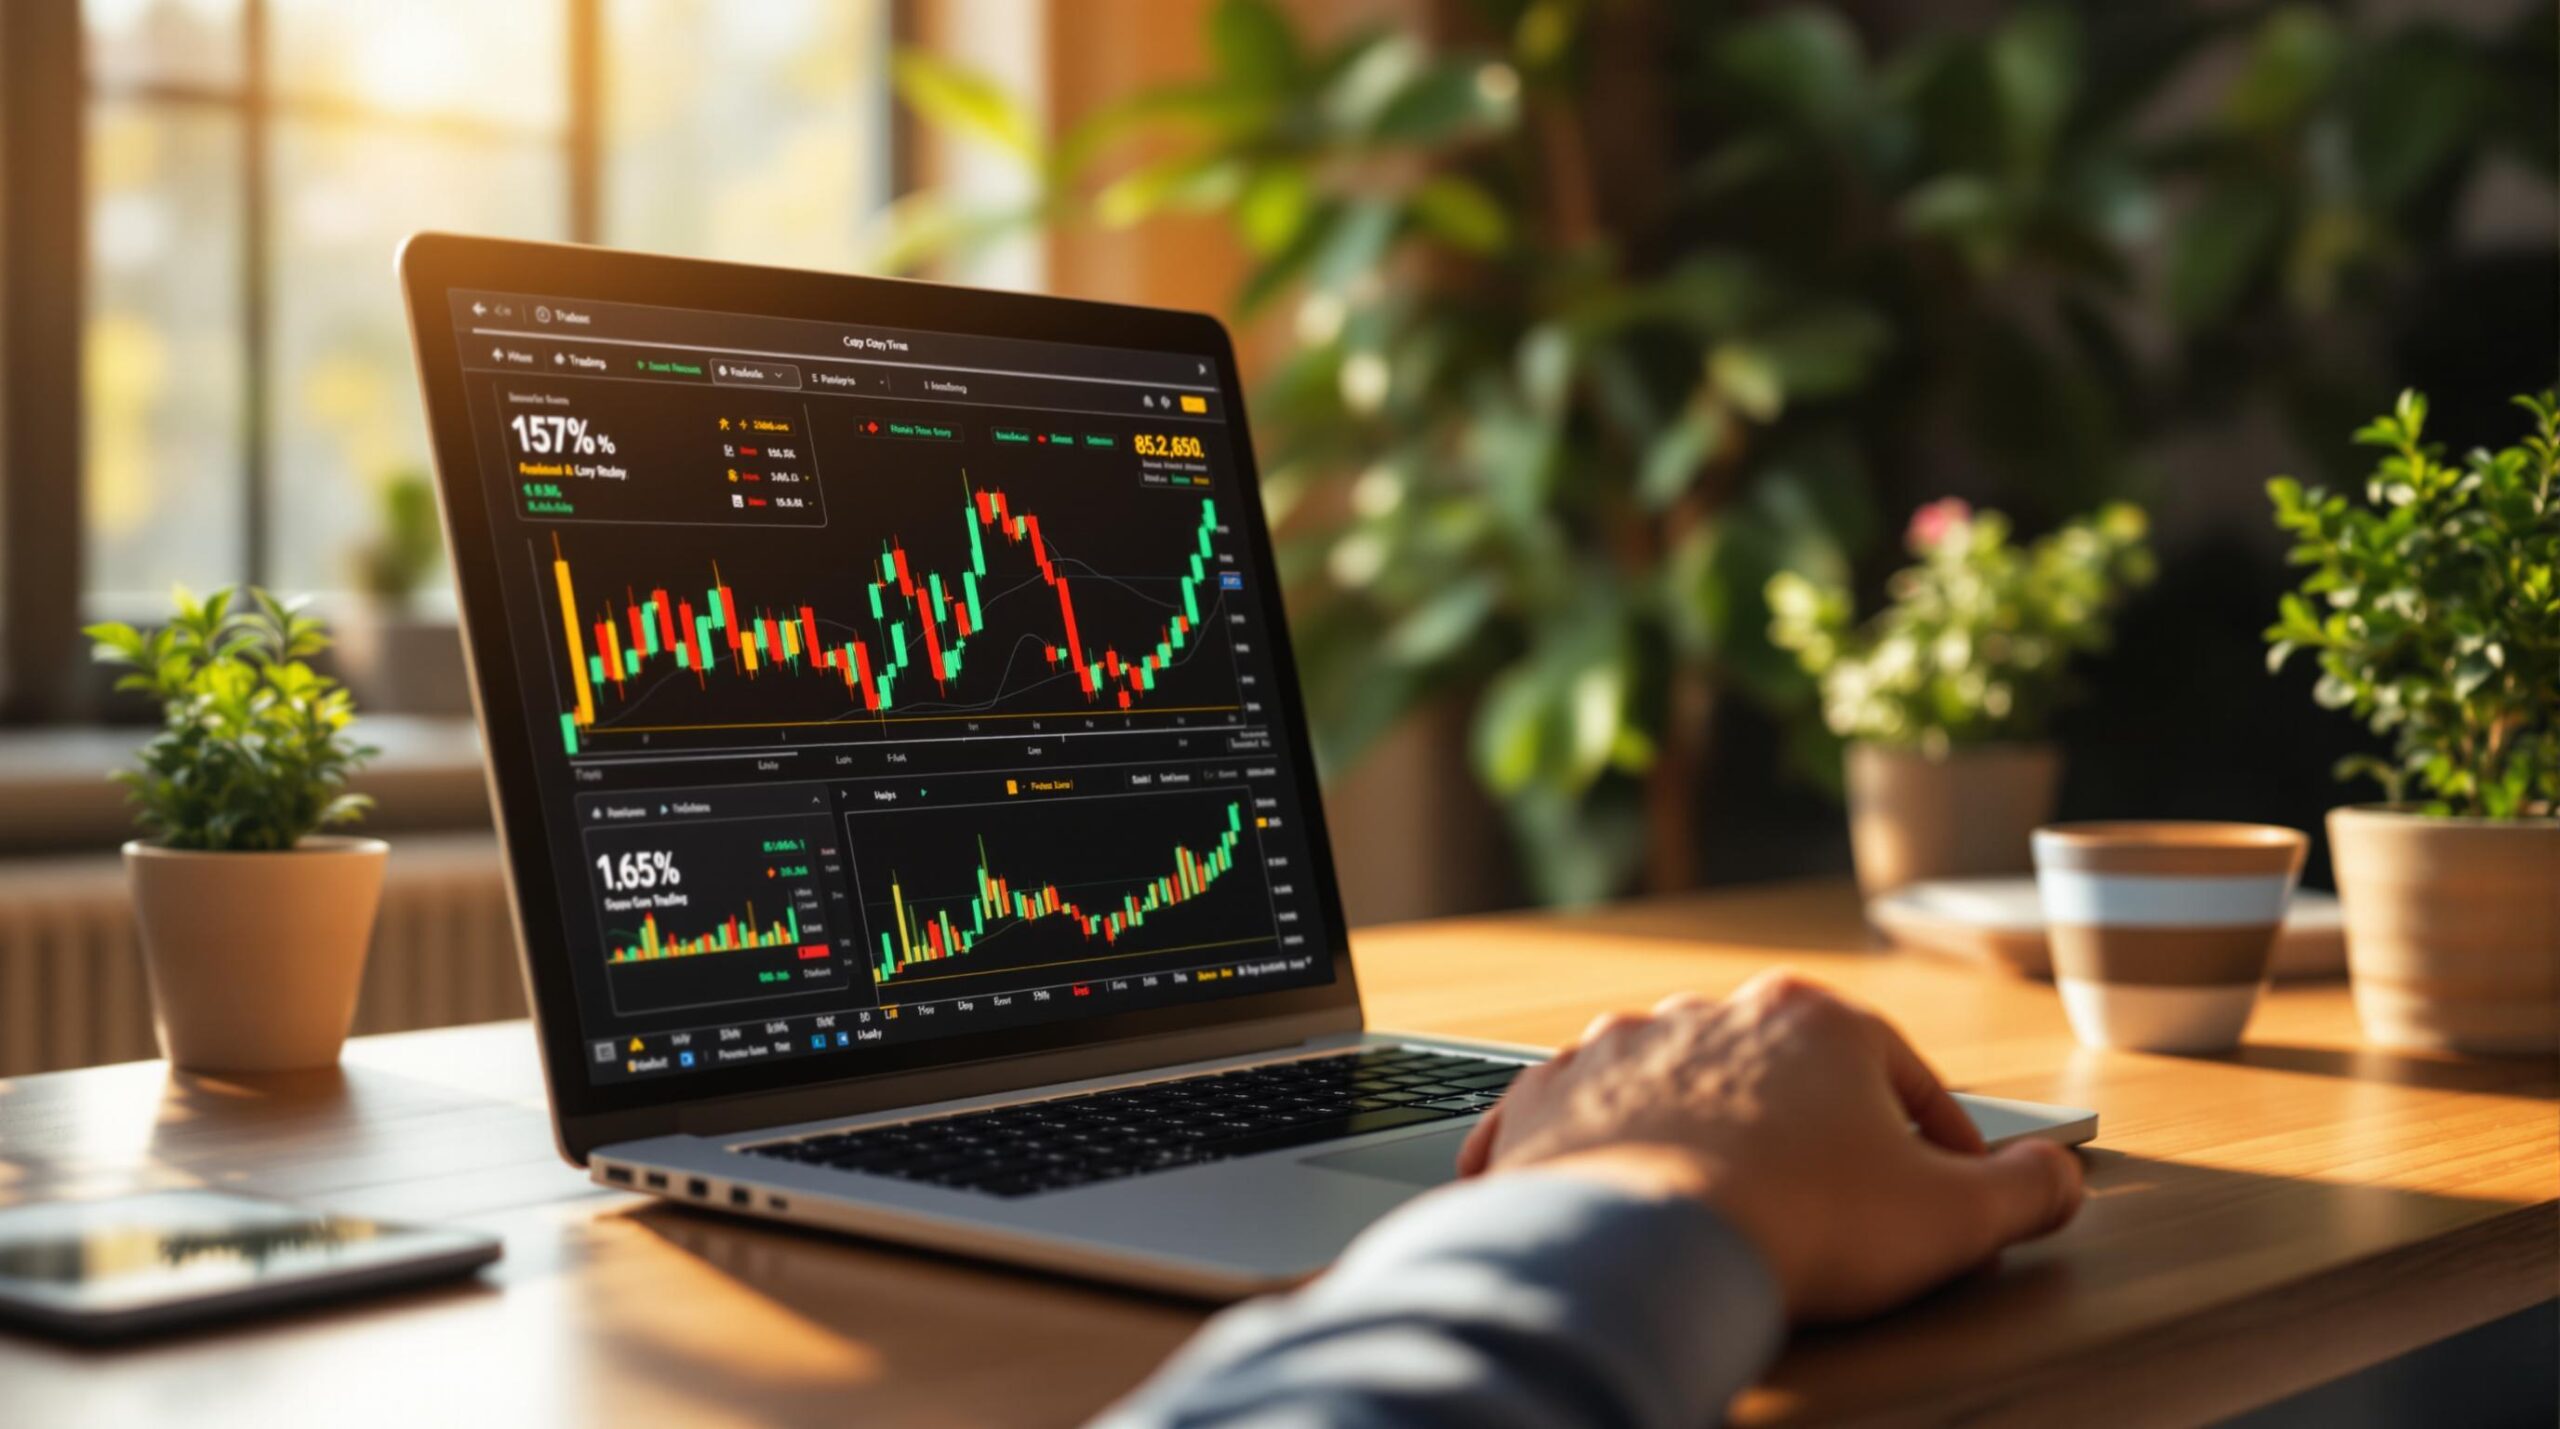
Copy trading lets you replicate expert traders’ strategies, but success depends on analyzing the right metrics. Here are five key metrics to evaluate performance and manage risk effectively:
- Total Returns: Measures overall profit (percentage and monetary value) over different timeframes.
- Risk-Adjusted Returns (Sharpe Ratio): Assesses efficiency by comparing returns to risk.
- Maximum Drawdown (MDD): Highlights the largest loss from a peak, showing downside risk.
- Win Rate: Tracks the percentage of profitable trades, balanced with profit margins and risk.
- Trading Consistency (Sortino Ratio): Focuses on managing negative volatility for stable performance.
1. Total Returns: Measuring Overall Profit
Total returns show the overall profit or loss of a trading strategy, giving you a straightforward way to assess performance. This metric is key to determining whether a strategy meets your financial goals.
When reviewing total returns, look at both the percentage gain and the actual monetary value. Consider the net profit or loss, the time frame, and the initial investment to get a complete picture.
Different time frames – like daily, monthly, or yearly – can reveal different insights. Longer periods tend to highlight more reliable trends in performance.
"The Estimated Copy Trading ROI gives an ideal vision of the Future Return on Investment and helps to make a Growth Plan for every investment." – Girolamo Aloe, Author
Using estimated ROI can help you anticipate growth and plan your investments. Consistent growth is usually a safer bet compared to unpredictable returns, even if the percentage outcome is the same.
Practical example: When assessing copy trading strategies, set clear benchmarks for total returns that align with your goals. For instance, a 30% return achieved through steady growth is more appealing than one resulting from dramatic ups and downs.
Don’t forget to account for platform fees when calculating your actual returns, as these can eat into your profits.
While total returns give you a snapshot of profitability, understanding the risks requires digging deeper into risk-adjusted returns.
2. Risk-Adjusted Returns: The Sharpe Ratio
The Sharpe Ratio measures how effectively returns are achieved relative to the risk taken. Simply put, a higher Sharpe Ratio means a trading strategy is more efficient, delivering better returns for the level of risk involved.
It works by dividing the average return by the standard deviation, giving you a clear picture of risk-adjusted performance. This approach ensures that the strategies you choose align with both your financial goals and your comfort with risk levels.
Here’s a practical example comparing three traders:
| Trader | Average Return | Standard Deviation | Sharpe Ratio |
|---|---|---|---|
| Trader A | 10% | 20% | 0.50 |
| Trader B | 10% | 30% | 0.33 |
| Trader C | 20% | 50% | 0.40 |
In this comparison, Trader A stands out with a higher Sharpe Ratio, showing better efficiency. Even though Trader C has a higher return, the added risk makes their strategy less efficient. This demonstrates why balancing returns with risk is so important.
When evaluating traders using the Sharpe Ratio, keep these factors in mind:
- Historical Performance: Look at past Sharpe Ratios to spot consistent efficiency.
- Risk Levels: Lower volatility often signals a more stable strategy.
- Comparison Tool: Use the ratio to compare traders with varying return and risk profiles.
"The Sharpe Ratio helps identify the most efficient trading strategies by providing a standardized measure of risk-adjusted return, enabling copy traders to make more informed decisions about which traders to follow."
That said, the Sharpe Ratio has its limits. It assumes returns are normally distributed and may overlook certain risks. A Sharpe Ratio above 1.0 is generally a good sign, but always consider market conditions and your personal risk tolerance.
While the Sharpe Ratio is great for assessing efficiency, don’t forget to also analyze maximum drawdown to understand potential losses.
3. Maximum Drawdown: Biggest Losses
Maximum drawdown (MDD) shows the steepest drop from a peak to a trough in a trader’s performance history. It gives you a clear idea of the worst loss you might face when copy trading. Unlike metrics like the Sharpe Ratio, which focus on risk-adjusted returns, MDD zeroes in on downside risk.
Here’s an example of how maximum drawdown works:
| Portfolio Value | Change | Maximum Drawdown |
|---|---|---|
| Initial: $500,000 | Peak Value | – |
| Peak: $750,000 | +50% | – |
| Trough: $400,000 | -46.7% | -46.7% |
| Recovery: $600,000 | +50% | -46.7% |
| Final Drop: $350,000 | -41.7% | -53.3% |
MDD is a useful way to gauge a trader’s risk management skills, set realistic expectations for potential losses, and compare traders’ risk profiles. When analyzing MDD, keep these factors in mind:
- Recovery Time: This shows how quickly a trader can bounce back from losses, offering insight into their resilience and strategy.
- Market Context: Evaluate the trader’s drawdowns against market benchmarks during similar periods to understand their relative performance.
- Risk Tolerance Alignment: Ensure the trader’s historical MDD aligns with your personal comfort level to avoid strategies that might feel too risky.
While MDD is a helpful tool for assessing risk, it works best when combined with other metrics to provide a full picture of a trader’s overall performance and risk management approach.
Understanding MDD is crucial, but it’s equally important to look at win rates to see how often a trader comes out ahead.
sbb-itb-c34bd9b
4. Win Rate: Success Frequency
Win rate measures how often a trader’s decisions lead to profitable trades. It’s calculated by dividing the number of successful trades by the total trades, then multiplying by 100. This simple formula gives insight into a strategy’s reliability.
But numbers alone don’t tell the full story. Here’s a quick comparison to add context:
| Win Rate | Total Trades | Profitable Trades | Risk Profile |
|---|---|---|---|
| 80% | 100 | 80 | Low risk |
| 60% | 100 | 60 | Moderate risk |
| 40% | 100 | 40 | High risk |
For example, scalping strategies often have higher win rates (around 80%) but smaller profits per trade. On the other hand, position trading might show a lower win rate (around 40%) but aims for larger profits. A higher win rate might seem appealing, but it must be considered alongside other factors. A trader with a 40% win rate could outperform someone with an 80% win rate if their profitable trades yield much larger returns than their losses.
Key points to keep in mind when assessing win rates:
- Look for consistent win rates across different time periods and market conditions.
- Ensure a sufficient number of trades to make the win rate statistically reliable.
- Consider how position sizing interacts with the win rate.
"A high win rate combined with high volatility can indicate greater risk. For instance, a trader with a 60% win rate and lower volatility may provide more stable returns than one with a 70% win rate but higher volatility."
Instead of focusing on short-term results, aim for the bigger picture. A trader maintaining a steady 55-65% win rate over several months is often more dependable than one with sporadic spikes in performance followed by steep declines.
Common mistakes in analyzing win rates:
- Failing to factor in profit margins.
- Overlooking trading fees.
- Ignoring the impact of market conditions.
Understanding win rates helps you align strategies with your financial goals and risk tolerance. The goal isn’t to win every trade but to achieve consistent results over time. Followers should aim for similar success rates as their chosen master trader, recognizing that steady performance matters more than occasional big wins.
While win rates show how often trades succeed, trading consistency goes deeper, highlighting the quality and stability of those successes.
5. Trading Consistency: The Sortino Ratio
The Sortino Ratio is a tool designed to measure trading consistency by focusing specifically on negative volatility. Unlike broader metrics, it hones in on how well traders handle downside risk, offering a clearer picture of strategy reliability.
For instance, imagine a copy trading strategy that delivers an average return of 10% with a 5% standard deviation in negative returns. This would result in a Sortino Ratio of 2.0, signaling strong performance when adjusted for risk.
What influences the Sortino Ratio? This metric zeroes in on negative returns, placing emphasis on factors like downside volatility, consistency over time, and the impact of varying market conditions.
When analyzing copy traders, pay attention to their Sortino Ratio across different market environments. A trader who maintains a ratio above 1.5 during both bull and bear markets demonstrates better risk management than one who only performs well in favorable conditions.
How to use it effectively:
- Compare Sortino Ratios across different trading cycles and timeframes.
- Factor in the market context when assessing performance.
- Pair this metric with others, like win rate, for a more complete evaluation.
In copy trading, the Sortino Ratio helps identify traders who can balance returns with controlled downside risk. While a higher ratio doesn’t guarantee future success, it does highlight a trader’s past ability to manage negative volatility while achieving returns.
Conclusion
To succeed in copy trading, analyzing performance metrics is crucial. While total returns are important, they should be viewed alongside other indicators to get a full understanding of a trader’s approach.
Here are some key metrics that paint a clearer picture:
- Risk-adjusted returns (like the Sharpe ratio) highlight traders who balance risk and reward effectively.
- Maximum drawdown shows the extent of potential losses during downturns.
- Win rate reflects the trader’s accuracy in executing profitable trades.
- Sortino ratio zeroes in on negative volatility, ignoring upward price movements.
By keeping an eye on these factors, you can make smarter choices and tweak your strategy when needed. For instance, a trader with a Sharpe ratio above 1.5, a 65% win rate, and drawdowns under 20% demonstrates better risk management than someone with higher returns but drawdowns in the 40-50% range.
For more tips and strategies, check out the COP.YT Blog, where you’ll find expert advice on applying these metrics to your trading. Regularly reviewing these numbers – ideally on a monthly basis – helps ensure your trading aligns with your goals and risk tolerance.
The goal? Find traders who perform well across multiple metrics while keeping risks in check. That’s the path to steady, long-term success.
FAQs
How to measure stock trading performance?
In copy trading, just like traditional stock trading, keeping track of performance is crucial. It helps ensure that the strategies you follow align with your financial goals. By focusing on specific metrics, traders can assess their performance more effectively.
One key metric is Profit Factor, which is calculated by dividing total wins by total losses. This shows how efficient a trader is. For example, even with fewer wins, a trader can achieve a high profit factor if the profits from those wins are substantial. Many traders also rely on the "2% Method", which limits risk per trade to 2% of the account value. This approach helps maintain controlled risk over time.
"Consistency and discipline are essential for long-term trading success."
Here are some important metrics to consider when evaluating trading performance:
- Profit Factor: Measures trading efficiency.
- Risk Management: Focuses on position sizing and exposure control.
- Win Rate Analysis: Looks at how often trades succeed, factoring in win/loss sizes.
- Trading Consistency: Emphasizes steady and sustainable performance.
To help track these metrics, you can use a structured framework like the one below:
| Metric | What to Measure | Target Range |
|---|---|---|
| Absolute Drawdown | Difference between initial deposit and lowest point | Keep under 20% |
| Profit Factor | Total wins divided by total losses | Above 1.5 |
| Risk per Trade | Position size relative to account | Maximum 2% |
| Win Rate | Percentage of successful trades | 40%+ with proper R-ratio |
Related Blog Posts
RELATED POSTS
View all